
How Much of Your Income Should Go to Each Category


The 50/30/20 rule splits take-home pay into needs (50%), wants (30%), and savings (20%). It works for moderate incomes in moderate-cost areas. The average US household spends $72,967 per year. At the median income, that barely leaves room for savings. The simple three-bucket model breaks down quickly when housing is expensive, debt is present, or income varies.
This guide goes one level deeper. It covers target ranges by category, warning signs when something is out of proportion, and how to adjust when the numbers don’t balance.
Start With Take-Home Pay, Not Gross
Every percentage here applies to take-home pay. What actually lands in the bank after taxes, health premiums, and retirement contributions come out. Gross income produces targets that don’t reflect what’s actually available.
A household earning $75,000 per year ends up with roughly $55,000 to $60,000 after taxes, FICA, and health insurance—around $4,600 to $5,000 per month. Work from that number, not the gross.
Housing: 25 to 30 Percent
Housing is the largest budget item for most people. The traditional 28% rule from mortgage lenders caps it at 28% of gross income. On a take-home basis, 25 to 30% is a practical target. That covers rent or mortgage, property taxes, insurance, and utilities.
In high-cost cities, housing often runs 35 to 40% of take-home. Renters need to earn $28.58 per hour to afford a two-bedroom apartment nationally. In major metros, that number is much higher. Once housing exceeds 35% of take-home, every other category gets squeezed.
Adjustment options are limited. A cheaper unit at the next lease renewal, a roommate, or a move. Housing is fixed once a lease is signed. That’s why it matters most to get right before committing.
Transportation: 10 to 15 Percent
Transportation covers car payment, fuel, insurance, registration, and maintenance. AAA puts average annual ownership costs for a new midsize sedan at $10,728 in 2023—roughly $894 per month. On a $5,000 take-home, that’s 18% before fuel. A new car payment is often the single decision that constrains the whole budget.
The 10 to 15% target requires an honest look at total transportation cost. At 20%, the car is consuming what savings or flexibility could use. A used car bought outright turns $500/month in payments into $100/month in maintenance—$400/month back.
Food: 10 to 15 Percent
The average household spends $9,343 per year on food—$779 per month. That’s roughly 13% of the average take-home. Food is one of the most adjustable categories. Restaurant and delivery spending can be cut without affecting nutrition. Store-brand substitution cuts grocery costs 20 to 25%.
The warning sign is the grocery-to-restaurant split. Most households spend 50 to 100% more eating out than they think. Three months of bank statements usually shows the real number.
Savings and Investments: 15 to 20 Percent
Savings gets its own line—not whatever’s left over. Fidelity recommends 15% of gross income annually toward retirement, including employer match. On a take-home basis the target is higher, since the base is smaller. 15 to 20% of take-home covers retirement, an emergency fund, and medium-term goals.
The sequence: employer matches first, then emergency fund to $1,000, then Roth IRA, then additional 401(k), then medium-term goals. Each step funds automatically before discretionary spending gets the money.
Debt Payments: Under 10 Percent Ideally
Minimum debt payments above 15% of take-home create a drag on everything else. At the average credit card rate of 21.47% debt above 10% of take-home costs more in interest than savings earned. Paying it down aggressively beats every other use of spare money.
Student loans and mortgages are different—lower rates, longer terms. The 10% target applies mainly to credit cards and personal loans. A mortgage above 10% of take-home isn’t a warning sign—it’s just the housing market.
Category Targets at a Glance
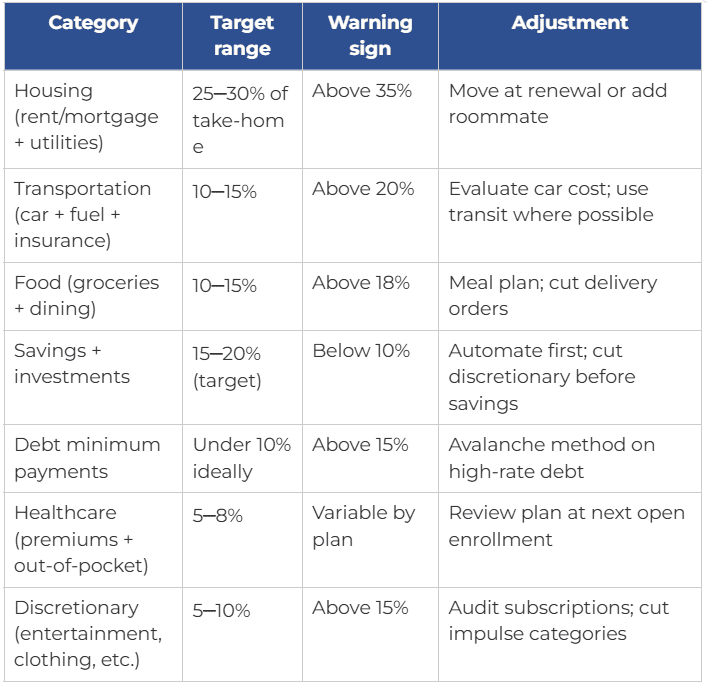
Benchmarks from BLS Consumer Expenditure Survey and standard financial planning guidelines.
When the Categories Don’t Add Up
In high-cost cities, housing above 35% is often unavoidable. When that happens, compress other categories. The order: cut discretionary first, then restaurant spending, then transportation. Savings is the last thing to cut. Dropping it below 10% creates problems that take years to recover from.
For variable-income households, apply percentages to the floor income. It’s the minimum reliable monthly amount. Extra money from high months goes to savings and debt before lifestyle expands.
When housing and transportation together exceed 50% of take-home, the rest of the budget can’t hold. Urban Institute research shows households spending above 50% on housing alone consistently struggle to meet other basic needs. The fix is income growth or a housing change—cutting other categories won’t solve it.
Bottom Line
These are ranges, not rules. Manhattan on $40,000 is different math than Indianapolis on $80,000. The percentages show which category is out of proportion. Housing and transportation are where most imbalances start—fix one of those and it creates more room than all the small cuts combined.
Disclaimer
This article is for informational purposes only and does not constitute financial advice. Individual situations vary. Consult a licensed financial advisor before making major financial decisions.

Sarah Mitchell
Sarah Mitchell, CFA Sarah spent eight years as an investment analyst before turning her attention to helping everyday Americans build wealth. She holds a CFA charter and writes about portfolio construction, retirement planning, and the math behind long-term financial independence. Her approach is rooted in data, not hype — she believes the best financial advice is boring, repeatable, and backed by numbers. When she's not writing, she's stress-testing her own retirement spreadsheet for fun.